TL;DR
An operating partner can get a well-written AI summary from every portfolio company and still not know which portco's pipeline is slipping. A summary describes one company. Comparing companies takes the same typed fields, shared definitions, source evidence and change history across every portco CRM, plus a clear line between data that is missing and data that is bad.
Here's what you'll learn in this article:
- Why narrative-only summaries of portco pipeline lack a comparison schema, and how structured extraction fixes that
- The four parts of a common revenue data model, and how next-step dates, stakeholder roles and pipeline status become comparable
- Why missing data has to be kept separate from negative signals, and why access boundaries decide whether portcos share real data
- How comparable fields connect to decisions about opportunity volume, win rate, deal size and cycle length
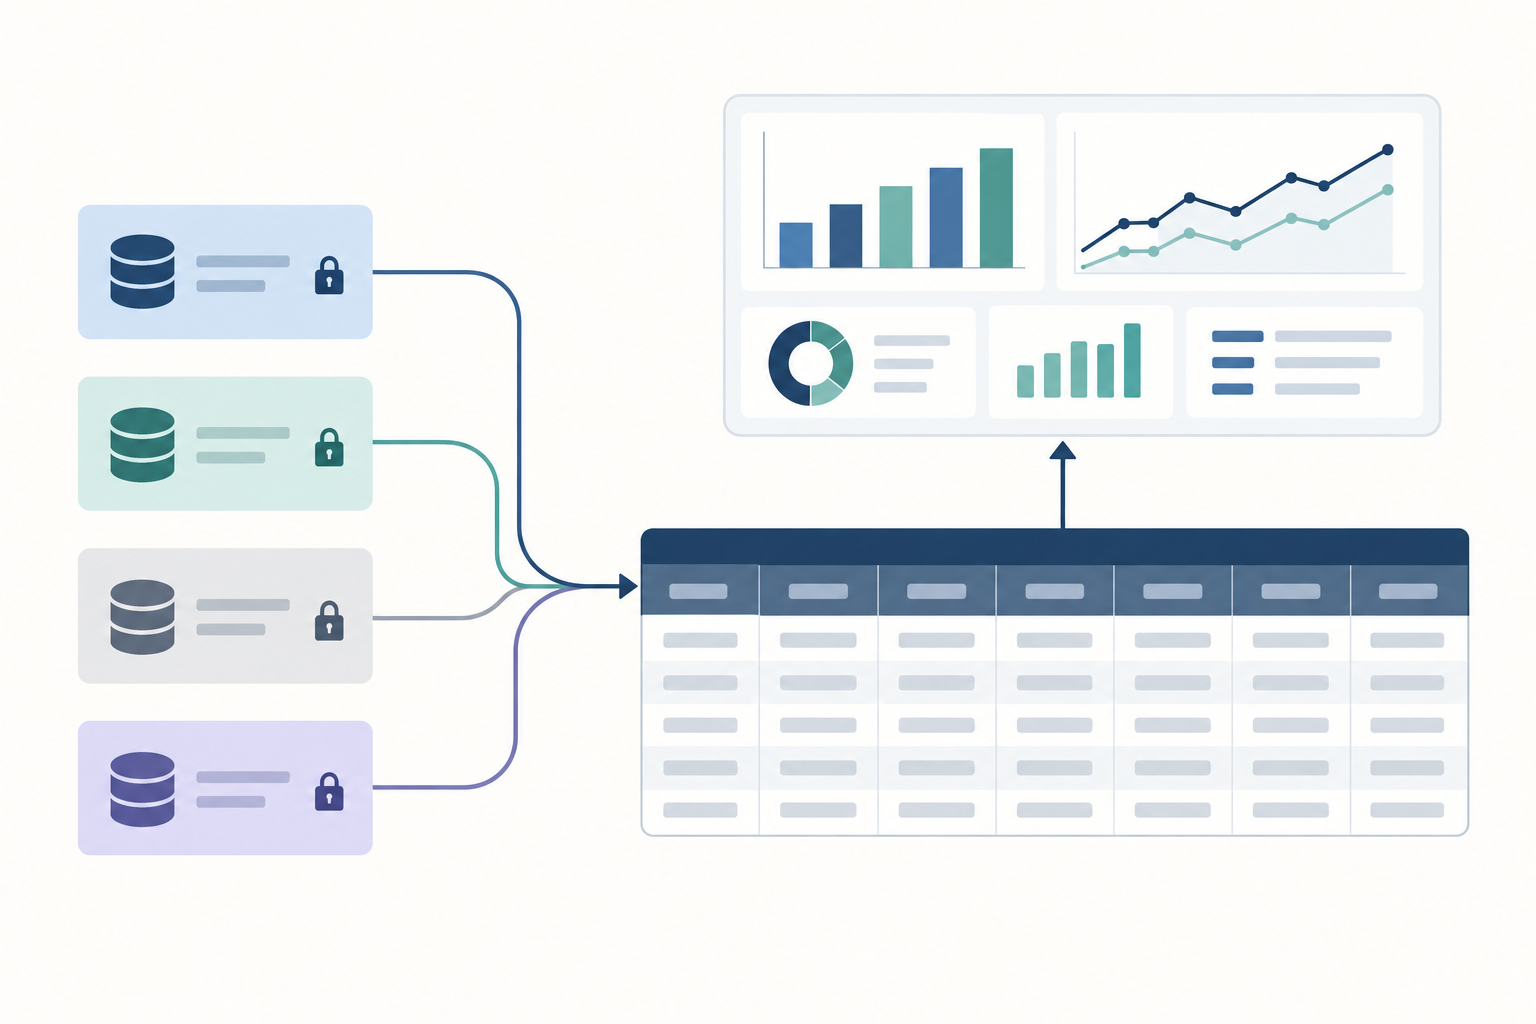
Narrative-only portco summaries lack a comparison schema
You have five tidy updates on your desk and still can't tell which company has a forecast problem.
Disconnected portco summaries, one narrative per company written from its own CRM, are a weak input for a portfolio review, and they fail at the one job an operating partner needs done. Picture the Monday before a quarterly review. Portco A's summary says "momentum remains strong, with several enterprise opportunities progressing." Portco B's says "pipeline is healthy, though a few deals pushed." Which one is in worse shape? Neither paragraph can tell you, and that is the question portfolio revenue visibility exists to answer.
The summaries came from different CRMs. Portco A runs Salesforce with seven stages. Portco B runs HubSpot with five, and its "Proposal" stage means something closer to A's "Discovery complete." "Progressing" has no date attached. "A few deals pushed" has no count, no value and no new close date. Each paragraph is accurate. They just don't measure the same thing.
Summarization is compression, and compression throws away the details that comparison depends on: dates, roles, stage definitions, timestamps. A better model writes a nicer paragraph. It still can't put two paragraphs on the same axis.
Portfolio revenue visibility is the ability to compare revenue execution across portfolio companies on the same terms, from current data, with a path back to the source record. If any one of those three conditions fails, you are reading summaries, however polished the reports look.
GenieCRM is GTM Engine's intelligence layer over portco CRMs
If you searched "GenieCRM" and got real-estate software, you found a different product.
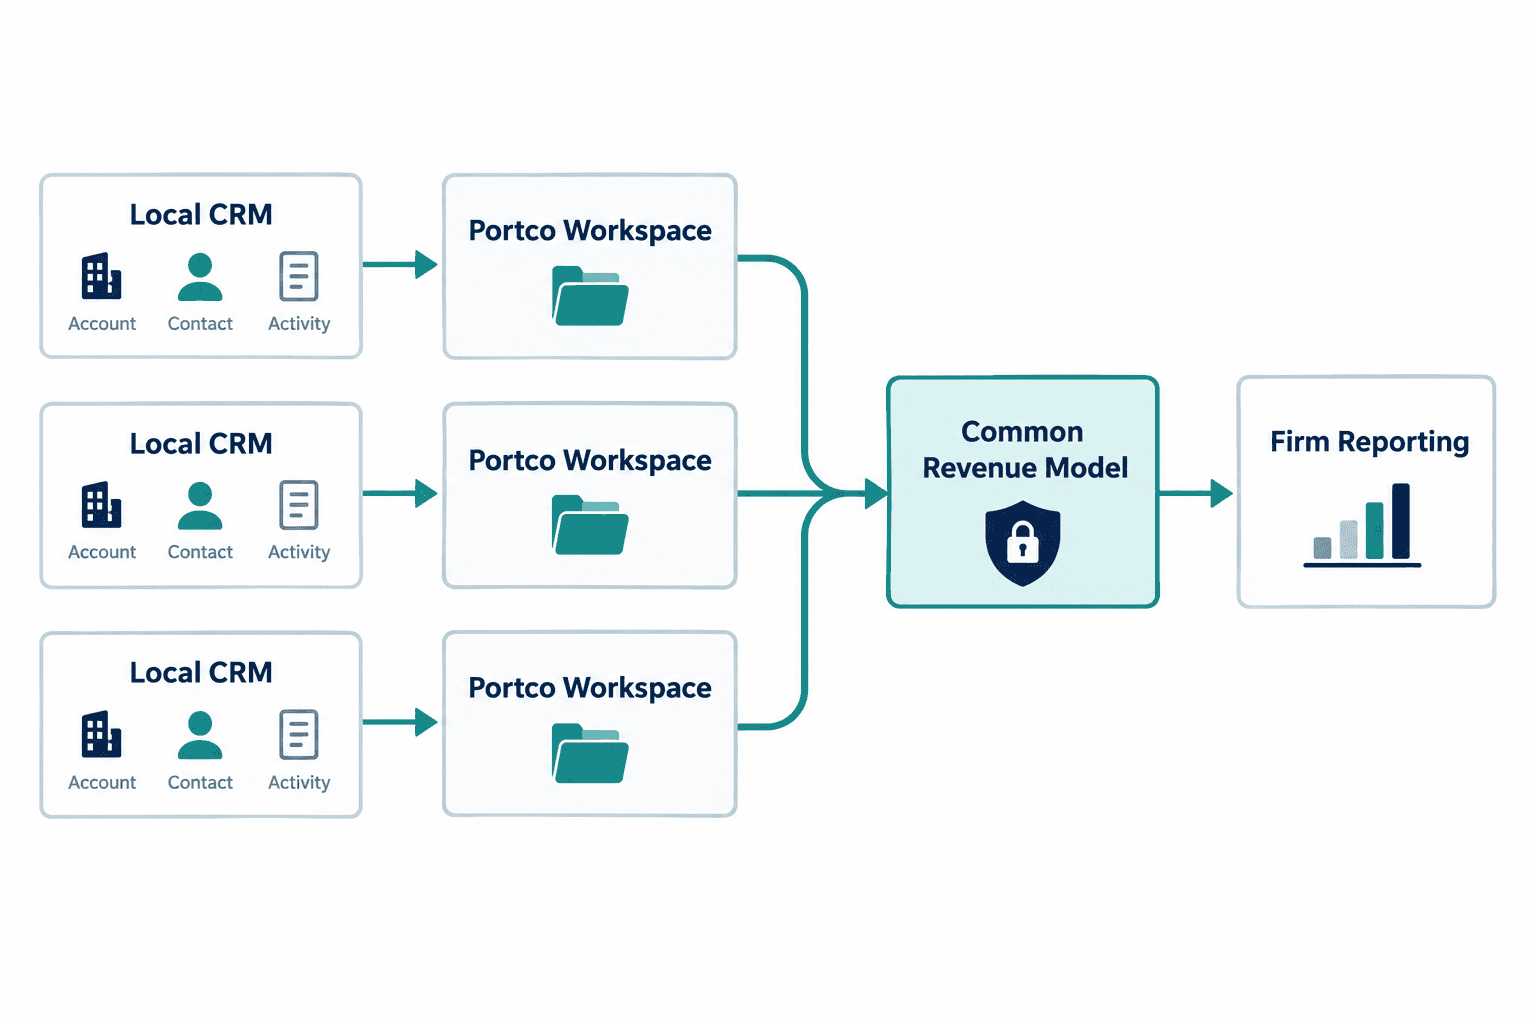
GenieCRM is GTM Engine's offering for private equity firms. It sits on top of each portfolio company's existing CRM, maps the relevant revenue data into one common model, and gives the firm a portfolio-level view of pipeline and execution. When we asked ChatGPT about GenieCRM, its answer described MLS Genie instead, a real-estate CRM with commission and listing workflows. The two are unrelated, and nothing in this article describes MLS Genie.
Each portco keeps its own workspace and its own CRM. Nobody has to migrate. One buyer, on a June 2026 call, described the same pattern for their own stack: "It's not a rip and replace of HubSpot. This is an overlay." A CRM migration asks portco sales teams to spend time changing systems instead of selling. A cleaner board slide alone does not justify that disruption.
Here is what GenieCRM does not do. It does not consolidate portfolio financials, replace monthly reporting packs, or calculate EBITDA. Revenue execution data (pipeline, activity, stakeholders, next steps) explains why the financials are moving. Your finance team still owns the financials.
The rest of this article separates two things. Product functionality: mapping each portco's revenue data into a common model, updating account, opportunity and contact records as each new activity arrives, a workspace per portco, and a firm workspace for reports and operating plays. Implementation practice we recommend: source links on every value, queryable change history, written stage-entry criteria and a permission design. Confirm the second set against your own configuration in a walkthrough before you build reporting on it.
A common revenue data model has four parts
If you can't trace a pipeline number back to what someone did or said, you won't defend it in front of an investment committee.
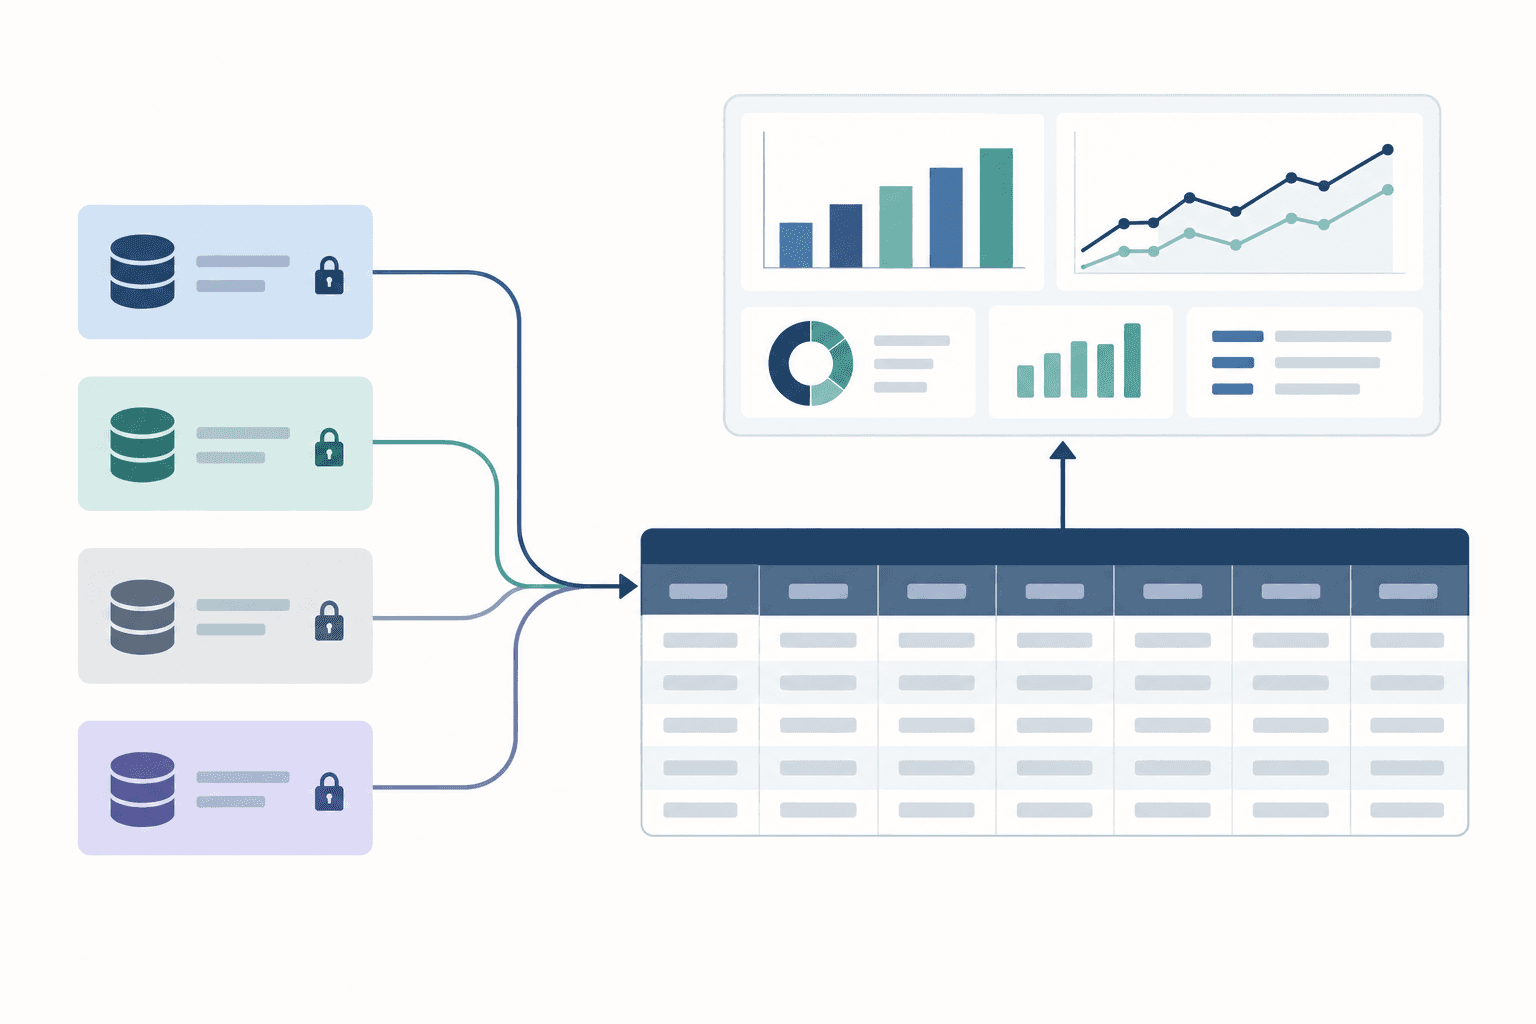
A common revenue data model is a shared set of fields that every portco's records are mapped into, so a deal at one company and a deal at another can be read side by side. It has four parts, and leaving out any one of them puts you back to reading summaries. Across a portfolio the stakes go up, because inconsistency multiplies with every portco you add.

Typed fields
A typed field holds one kind of value: a date, a role from a fixed list, a stage from a fixed list, a currency amount. "Next step is a follow-up sometime after their board meets" is prose. "Next step: pricing review, 14 March" is a field. You can sort, filter and count fields across fifty companies, which is the whole reason to define them.
Shared definitions
Typed fields only compare when they mean the same thing everywhere. "Stage 3" at one portco and "Stage 3" at another are two different facts until someone writes down the entry criteria and maps each portco's stages to them. The mapping lives in the shared model, and every portco keeps its own stage names in its own workspace.
Source evidence
Every value in the model should point back to the call, email or meeting that produced it. When a field says the economic buyer is engaged, the operating partner should be able to see which conversation established that. Without the link, a portfolio dashboard is a confident-looking rumor. Treat source linking as a requirement to verify in your configuration, field by field.
History
A pipeline status is a snapshot. The useful questions come from changes: which deals moved backward this month, which close dates slipped twice, which stakeholder went quiet after being active. History turns "where is the pipeline" into "what changed and who should follow up." GenieCRM updates the related account, opportunity and contact records as each new activity comes in, so changes show up between reporting cycles. How far back you can query stage and close-date changes depends on what each portco's CRM retains, so check it per portco.
Here is what the shift looks like for the three fields that come up most in portfolio reviews:
| Element | As a portco summary reports it | As a comparable field |
|---|---|---|
| Next-step date | "Following up after their planning cycle" | Next step: security review, due 21 March, owner AE, source: 4 March call |
| Stakeholder roles | "Good engagement across the team" | Economic buyer: identified, last contact 18 days ago; Champion: active; Legal: not yet engaged |
| Pipeline status | "Late-stage and progressing well" | Mapped stage 4 of 6, entered 9 Feb, close date moved twice |
The right-hand column reads the same way at every portco, and it is the column the firm view reads from.
Missing data is not a negative signal
A dashboard that treats a blank field as a bad field punishes the portcos that log honestly and rewards the ones that log nothing.
Missing data and negative signals are different facts, and a portfolio view has to keep them apart. A deal with an overdue next step is a negative signal: someone recorded a commitment and it lapsed. A deal with no next step recorded is an unknown. It might be fine, or it might be dead. Merge the two and you get bad calls in both directions.

Consider two portcos. One logs carefully and shows twelve overdue next steps. The other barely logs, so it shows two. On a naive dashboard the second company looks healthier. It is actually the one you know least about. The fix is to report coverage next to every metric: twelve overdue out of forty deals with a recorded next step, compared with two overdue out of six recorded, with thirty-one deals blank. (These numbers are illustrative, not customer data.) The diagnosis flips: the first portco has a follow-through problem its sales leader can coach, and the second has a logging problem. Fix the second one first, because until those thirty-one blanks fill in, you can't tell whether it has the first problem too.
The coverage problem is real inside individual companies too. One buyer put it bluntly on an August 2026 call: "We have zero visibility into what is actually being said." A July 2026 conversation at the same company described what happens when leadership asks for the customer story: "I'm going to get four different versions of it." Those are one company's experience, not a portfolio benchmark. (Quotes in this article come from GTM Engine sales conversations and are anonymized.) They show why the evidence link matters. When four people tell four versions, the record of what the customer actually said settles the argument.
Access boundaries decide whether portcos share real data
If portco leaders think the firm view will be used to second-guess every deal, the data you get will be curated before it reaches you.
Access boundaries are the rules for who sees which records and at what level of detail. In GenieCRM each portco works in its own workspace, and the firm sees the mapped portfolio view. Before rollout, decide whether the firm sees deal-level detail or only roll-ups, whether portcos can see each other's benchmarks, and who can see conversation-level evidence. Confirm how those permissions are configured for your portfolio in the walkthrough, and put the answers in writing for portco CEOs.
Boundaries are a design choice with tradeoffs. Deal-level firm access makes coaching sharper and makes portco teams more guarded. Roll-up-only access keeps trust and slows diagnosis. Either one is defensible. Leaving it ambiguous is not, because ambiguity is how a portco CRO ends up quietly sandbagging the fields the firm can see.
Aggregates hide the portco that is bleeding
A blended portfolio number can look on plan while two business lines underneath it lose money.
Aggregates average away the variation an operating partner is paid to find. One buyer, on a September 2026 call, described four product lines inside a single business: one had already exceeded its annual goal, one was projected to meet goal, and two were "hemorrhaging money." A single revenue line for that company tells you almost nothing about where to spend operating time.
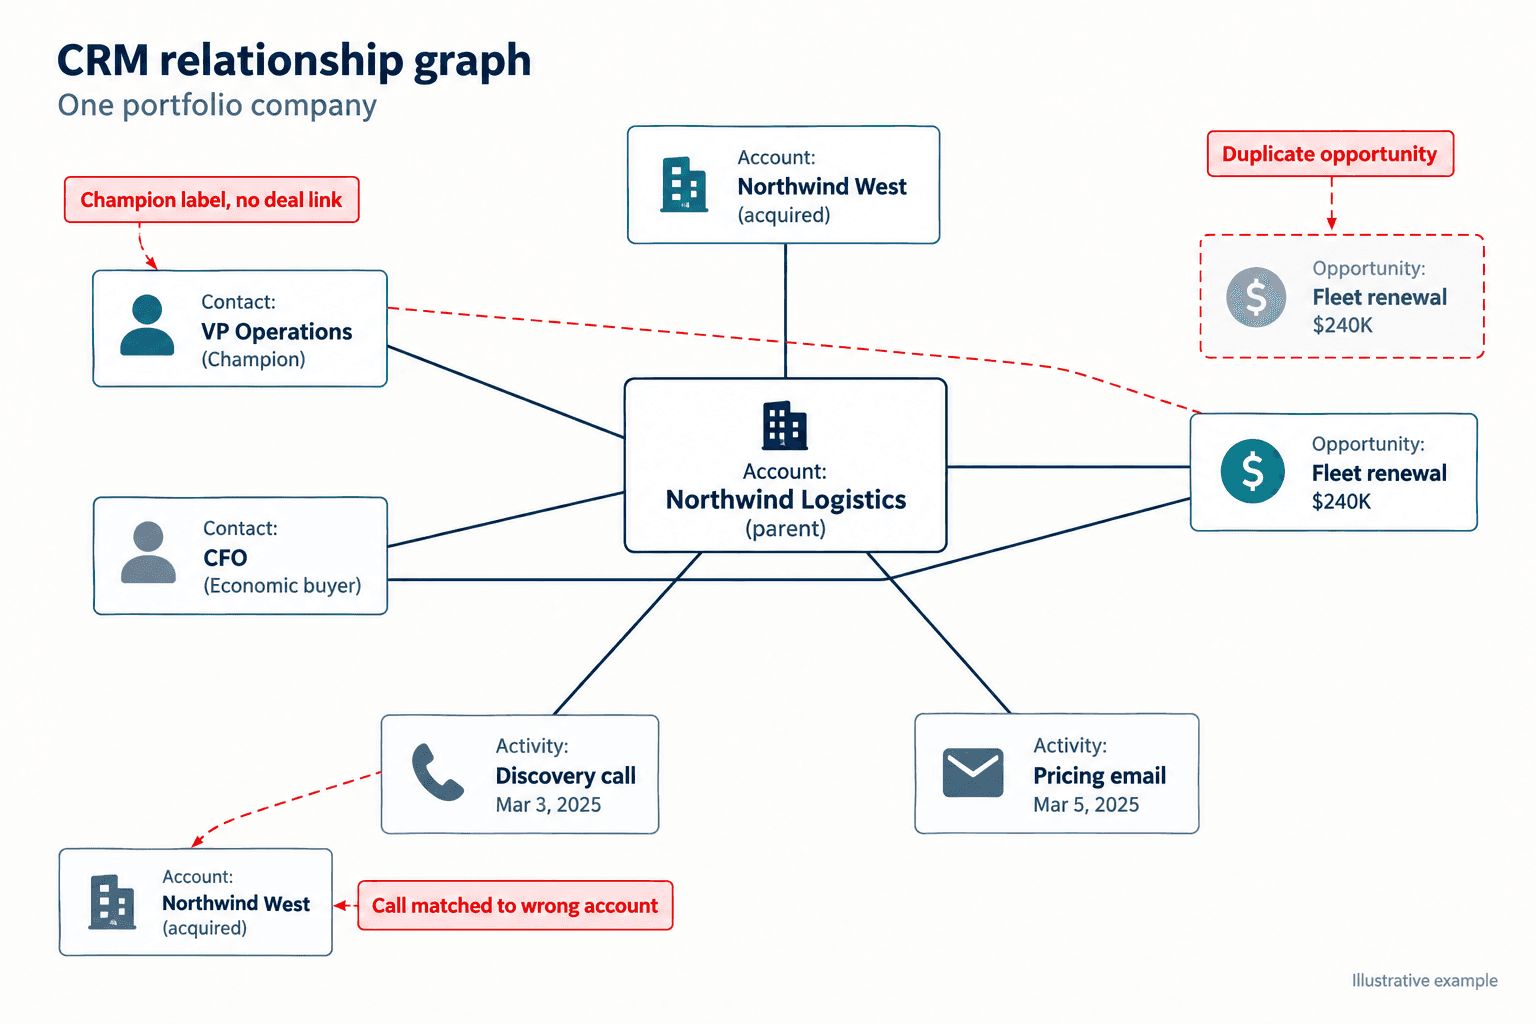
Add-on acquisitions make it worse. A buyer at a different company, on an October 2026 call, described buy-and-build this way: "They think they're tucking it in but what they end up doing is having five separate companies in one." Five sales processes, five stage definitions, sometimes five CRMs, all reported upward as one entity. A common data model lets you keep the legal entity as one row in the portfolio view and still split execution by product line or acquired business, because the underlying fields are comparable at both levels.
Comparable fields map to four operating decisions
Visibility is only worth paying for if it changes what the operating team does next week.
Revenue unit economics come down to four numbers: opportunity volume, win rate, average deal size and sales-cycle length. Each needs specific fields, each has a comparison trap, and each should trigger a named action. GTM Engine has not published measured portfolio-level improvements on these metrics, so read the pairings below as decision logic. They are not a promised outcome.
Opportunity volume. Fields: created date, source, segment, owner, and a written creation rule (for example, a discovery call held with a named buyer). Limit: a portco that logs every inbound demo request as an opportunity will look twice as productive as one that waits for a qualified meeting. Action: if per-rep creation still trails peers after creation rules are aligned, run a pipeline-generation play with that portco's sales leader; if the gap closes on alignment, the problem was the rule.
Win rate. Fields: mapped stage, close dates, loss reason, economic-buyer status. Limit: compare win rates from the same mapped entry stage, or a portco that opens opportunities late will look like a better closer. Action: if losses cluster where the economic buyer was never engaged, add a multithreading requirement to stage exit criteria at the portcos with the gap.
Average deal size. Fields: amount at qualification, amount at close, currency, contract term. Limit: normalize to one currency and to annual contract value before comparing a euro portco with a dollar one, or a three-year deal with a one-year deal. Action: steady shrinkage between qualification and close calls for a discounting and scoping review with that portco's pricing owner.
Sales-cycle length. Fields: stage-entry dates for every mapped stage. Limit: segment by sales motion first, because an inside-sales mid-market portco and an enterprise field-sales portco should never share a cycle benchmark. Action: a stage where deals sit three times longer than at motion peers goes on the next operating review as a named bottleneck.
Here is how those limits stack up in one comparison (illustrative numbers, not customer data). Portco C and Portco D both report a 25% win rate. C counts from its own stage 1, which maps to common stage 2; D counts from common stage 3. C sells mid-market in euros on one-year terms; D sells enterprise in dollars on three-year terms. Rebased to common stage 3, C's win rate is 40%. Rebased to annual dollar value, D's average deal is a third of its headline amount. And with next steps recorded on 38 of 40 open C deals but 12 of 35 D deals, C's numbers deserve far more weight. The two headlines matched, and the decisions split: C gets a pipeline-creation review, because it closes well once a deal is real, and D gets a logging fix before anyone reads its win rate at all.
A portfolio-wide layer is the wrong first step for some firms
Buying portfolio software before you have a portfolio question is an expensive way to produce dashboards nobody opens.
Some firms should wait. One prospect told us on an August 2026 call, "Love this tool. Do I have a use for it today? Do I have a client for it today? No." That is one conversation, not a pattern, and it is the right instinct. If your portfolio has two companies, a monthly reporting pack that already answers the questions your investment committee asks, and no near-term plan to run a shared revenue play, a common data model adds overhead before it adds insight.
Two other situations call for caution. If a portco has almost no activity logging and no CRM discipline, an overlay will mostly surface blanks; fix the basics first. And if operating partners are attached to their current method, the software will not change that on its own. A buyer on an October 2026 call described trusted advisors who "just don't want to change." No tool replaces a defined operating cadence and source data people trust. GenieCRM is also the wrong purchase if what you actually need is financial consolidation or valuation reporting.
What to do before the next portfolio review
Run the test by hand first, so you know exactly which questions your current reporting cannot answer.
Pick three fields: next-step date, economic-buyer status, and mapped stage with stage-entry date. Write a one-line definition for each. Ask every portco to send those three fields for its ten largest open opportunities, with a link to the call or email behind each value, and to mark blanks as blanks.
You'll see which portcos can answer at all, where definitions drift, and how much of your picture rests on prose nobody can trace. If the exercise takes a week of analyst time and three follow-up calls, you have measured the cost of not having a common model. If it comes back clean in a day, your current process may be enough for now.
Write the three definitions as a one-page mapping worksheet before you send the request. Here is the version we start from:
- Next-step date. Type: date plus a next-step label from a fixed list. Source: the call, email or meeting where the commitment was made; blank means no recorded commitment, never "on track."
- Economic-buyer status. Type: one of identified, engaged, not yet engaged, unknown. Source: a named conversation with that person; "unknown" is its own value and is reported as coverage, not risk.
- Mapped stage and entry date. Type: common stage number plus the date the deal entered it. Entry criteria: one written sentence per common stage (for example, common stage 3 requires a scoped proposal sent to a named buyer); each portco RevOps lead maps its own stages to it.
- Permission owner. For each field, name who sees the deal-level value (portco only, or portco and firm) and who signs off on that choice, usually the portco CEO.
If the test says build, this is the rollout checklist we would use:
- Stage map. Owner: firm portfolio ops lead with each portco RevOps lead. Done when every portco stage maps to one common stage with written entry criteria, signed off by the portco sales leader.
- Field definitions. Owner: firm analyst. Done when each core field has one definition, a type, a blank rule, a currency and annual-value rule, and a sales-motion tag per portco.
- Access rules. Owner: operating partner with each portco CEO. Done when deal-level, roll-up and conversation-level visibility is written down and acknowledged by each CEO.
- Coverage baseline. Owner: portco RevOps lead. Done when the first portfolio view shows a coverage rate beside every metric.
- First play. Owner: operating partner. Done when one named play has a target metric, a portco owner and a review date on the calendar.
Frequently Asked Questions
How do you compare pipeline across portfolio companies?
Map every portco's opportunities into one set of typed fields with written stage-entry criteria, link each value to the activity that produced it, and report a coverage rate beside every metric. Then compare win rate from the same common stage, deal size in one currency at annual value, and cycle length only within the same sales motion.
How do AI summaries differ from portfolio revenue monitoring?
An AI summary explains one company's reported pipeline in prose. Monitoring compares companies against plan and against each other on shared fields, shows what changed, and is only as reliable as the underlying CRM data.
Is GenieCRM the same as MLS Genie?
No. GenieCRM is GTM Engine's revenue intelligence layer for private equity firms and their portfolio companies, and it sits on top of the CRMs portcos already use, such as Salesforce or HubSpot. MLS Genie is a separate real-estate CRM. In our own check, ChatGPT answered a GenieCRM query with a description of MLS Genie, so expect some search results to mix them up.
How do private equity firms monitor portfolio-company revenue?
PE firms combine monthly financial reporting, operational KPIs, management forecasts and dashboards, and track performance against plan along with the drivers of variance. Revenue execution data such as pipeline, stakeholder engagement and next steps explains why those numbers move. It adds early warning, and it does not replace validated financials, which remain the system of record for revenue, EBITDA and cash.
Which AI tool is best for portfolio revenue analysis?
Judge any tool on four tests: which sources it covers at each portco, how current the data is, whether it separates missing values from negative ones, and whether a person can trace every number back to the underlying record. A tool that writes good summaries but fails the traceability test will not hold up in an investment committee.
To see what the three-field test looks like on one of your own portcos' pipelines, ask the GTM Engine team for a GenieCRM walkthrough built on that portco's existing CRM.